CPanel user guide
Accessing the plugin
Following successful execution of the previous steps, each user of this WHM server gains access to the Blackwall Protection settings in the cPanel web control panel. To access these settings:
- Log in to the cPanel web control panel that you have installed Blackwall to in previous steps.
- From the left sidebar, click Tools.
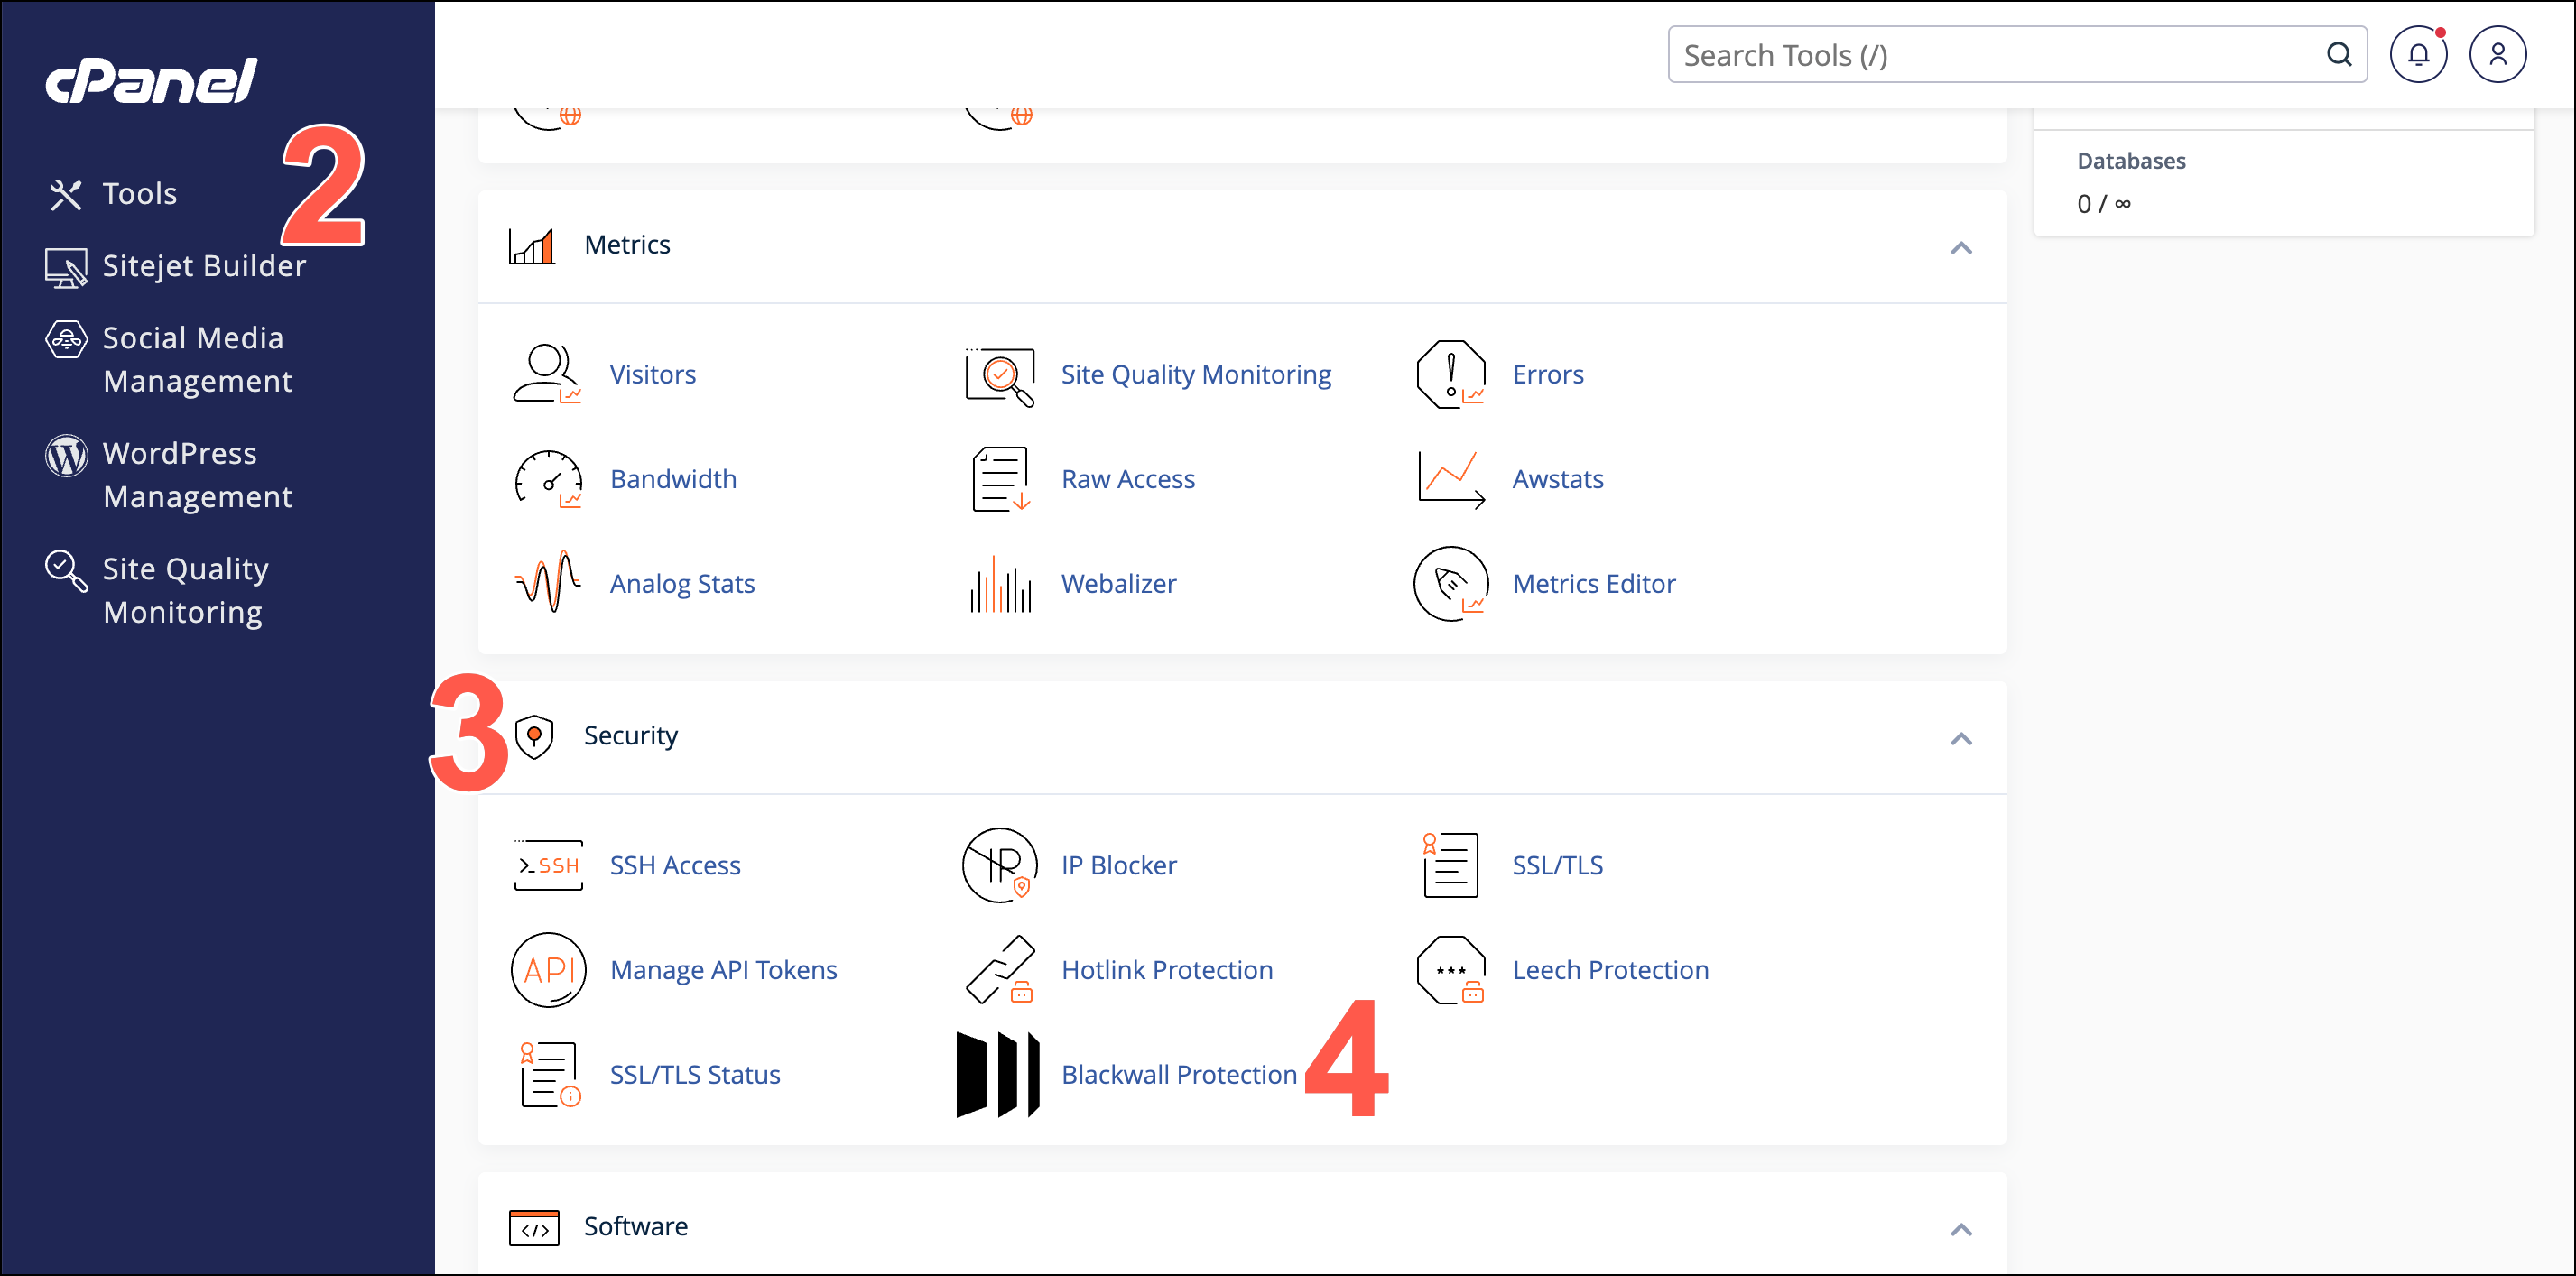
- Scroll to the Security section of the Tools page.
- Click Blackwall Protection.
Availability of Components/Features
Blackwall enables hosting providers to enable or disable some components and features in this plugin. If a component or feature is not enabled, a warning message displays "This functionality is not available in your plan, contact your admin."
Enabling/disabling domain protection
Now that the plugin is installed and configured, you can enable or disable protection for your domain and associated subdomains:
- Access the Blackwall Protection plugin by following the steps in Accessing the plugin.
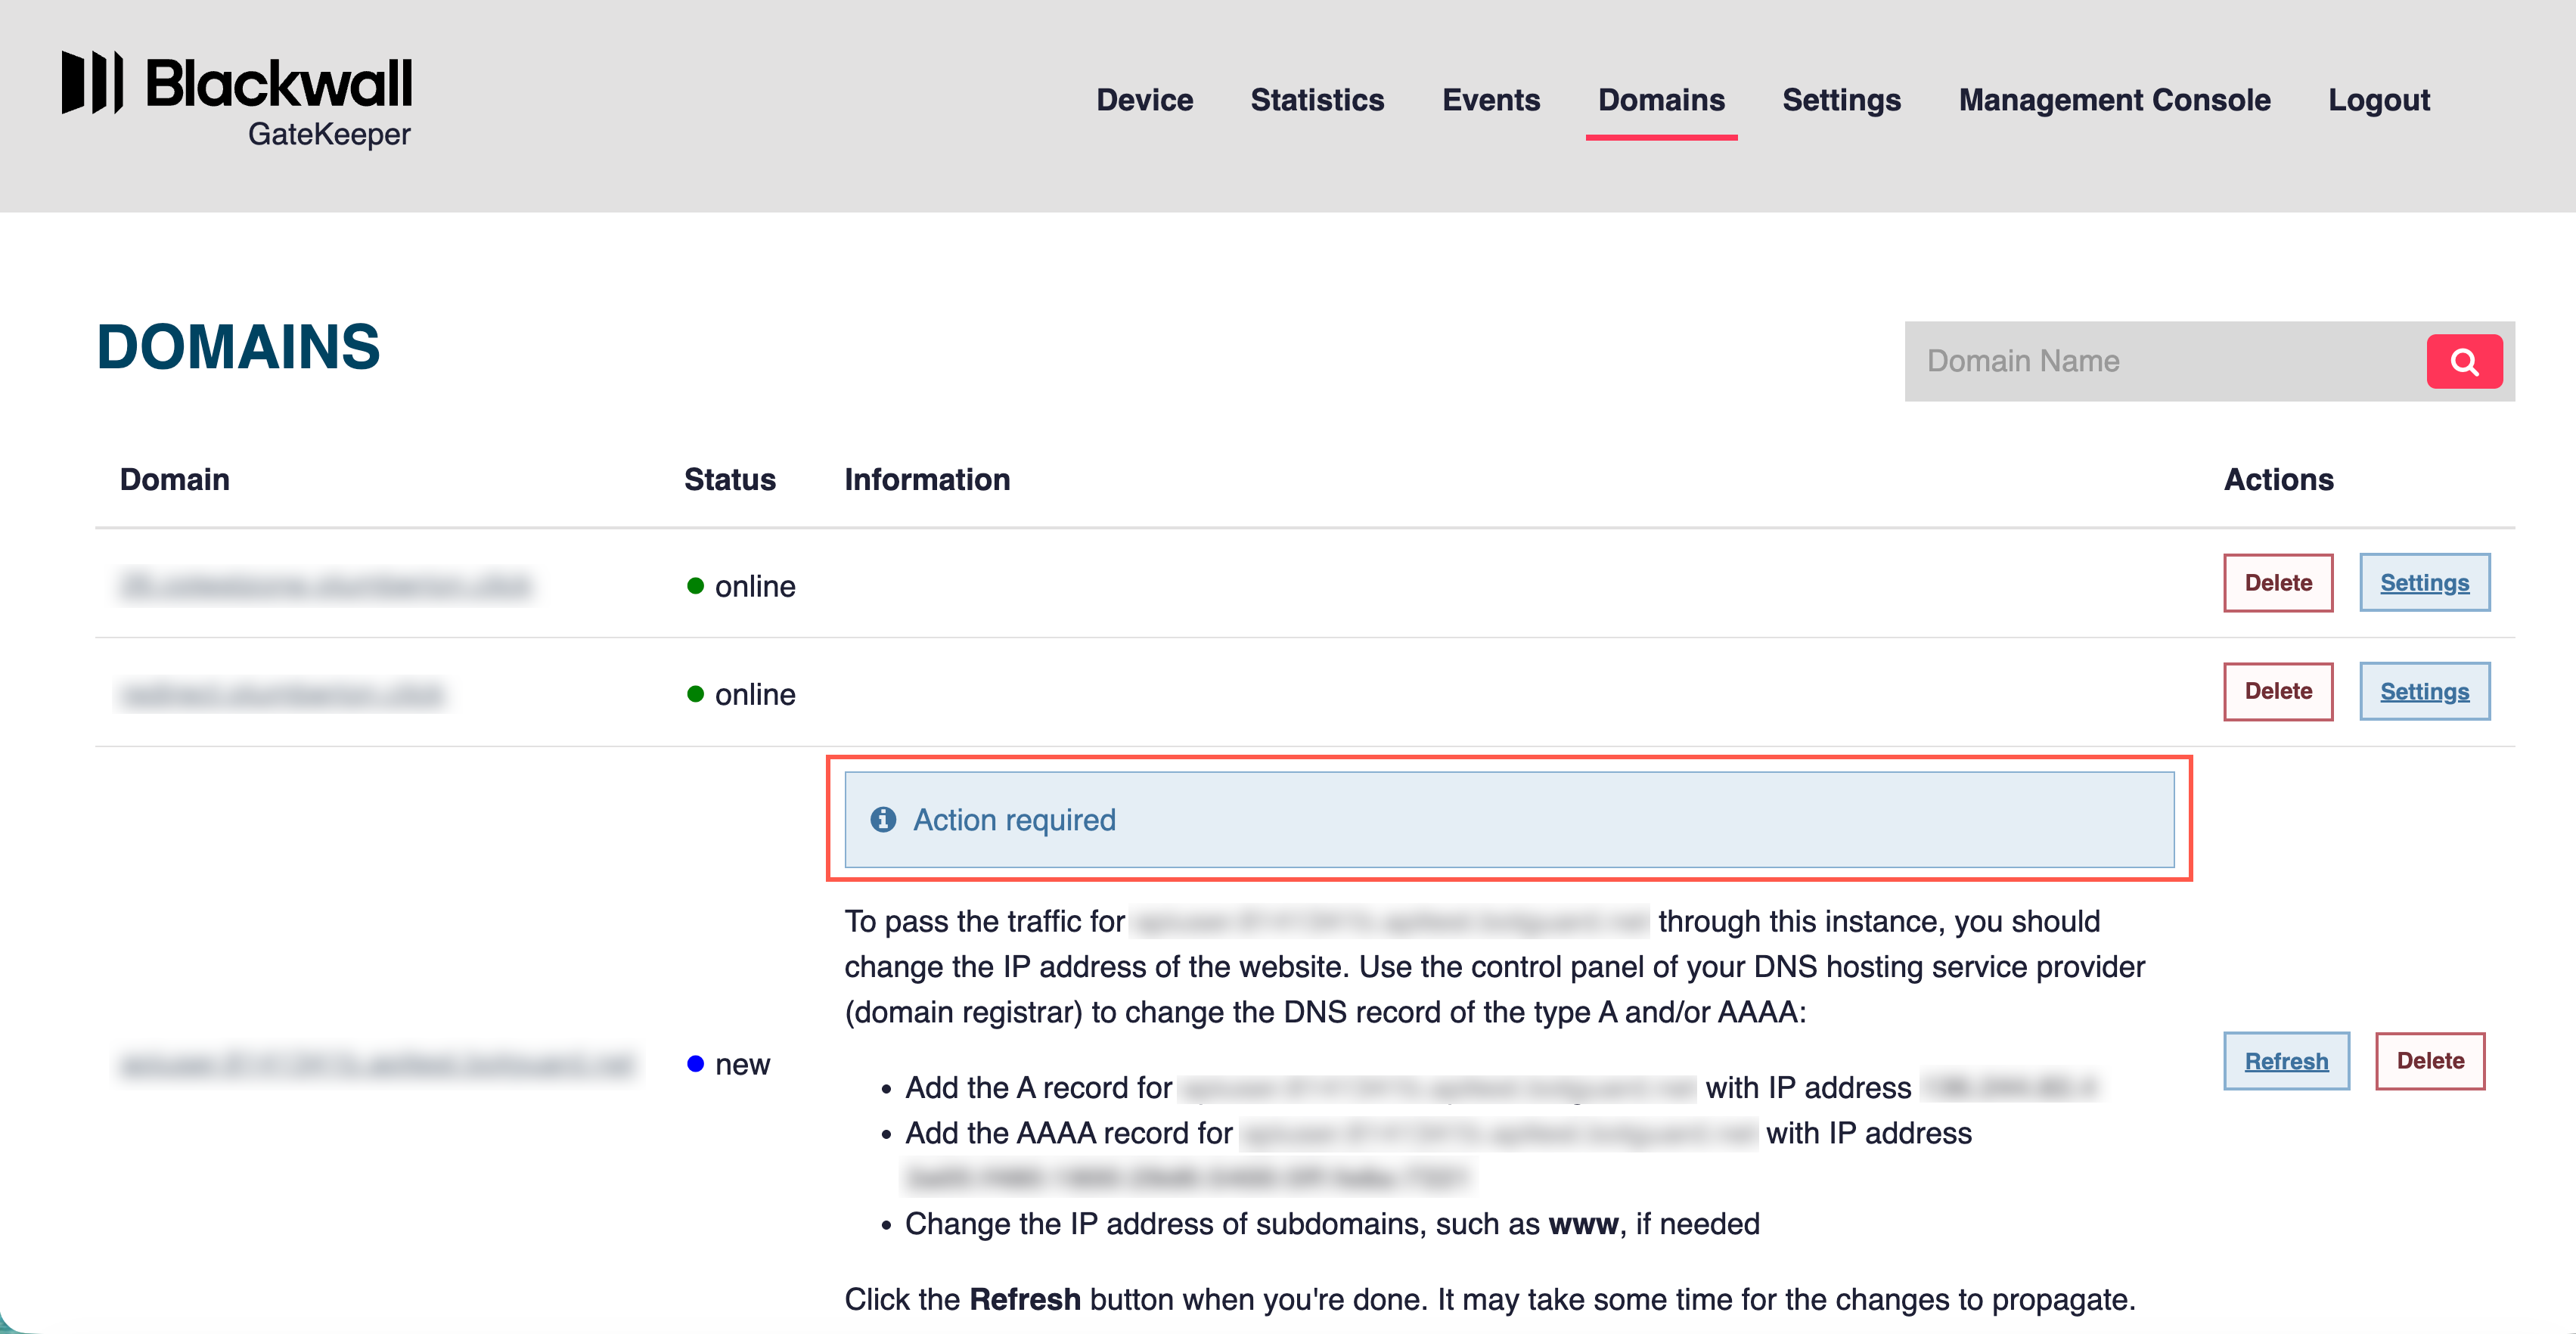
- On the page displayed, check that the added website domain is not displaying the Not registered tag. If the Not registered tag displays, register the website in GateKeeper and then refresh this page again.
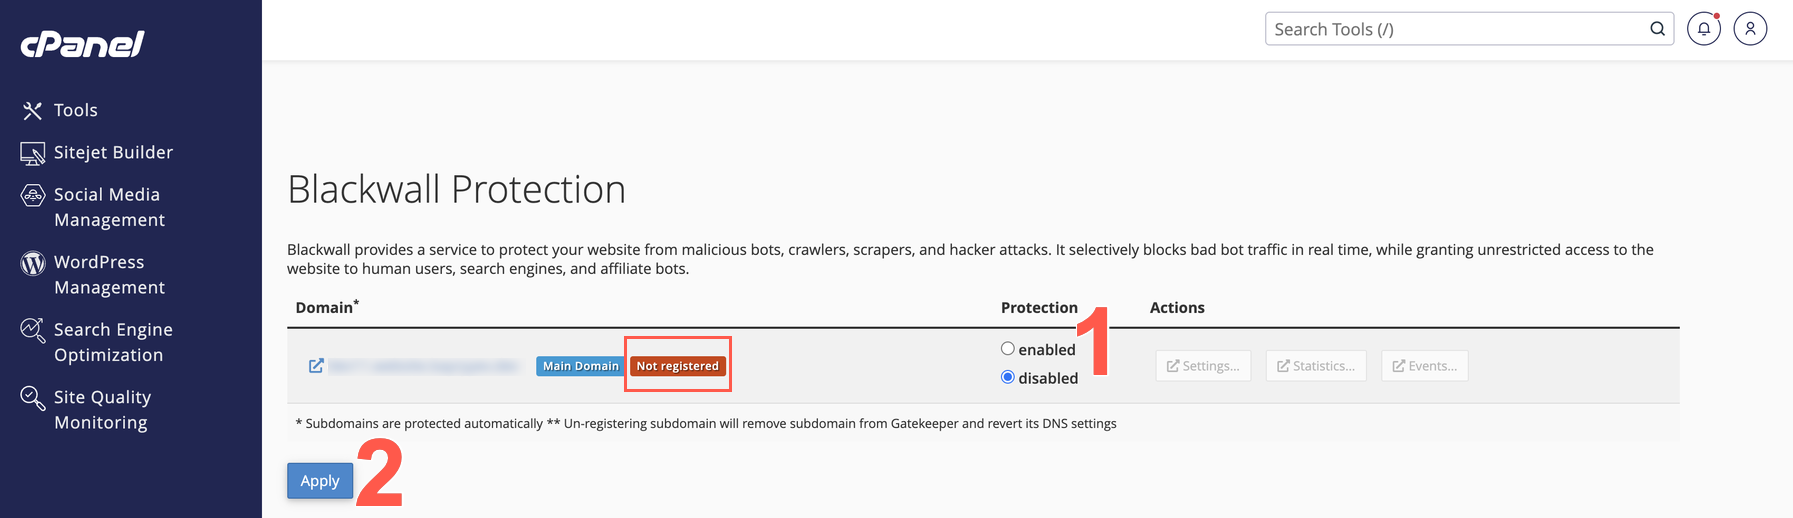
- To enable or disable protection for a website domain, click either the enabled or disabled radio buttons beside your listed domain.
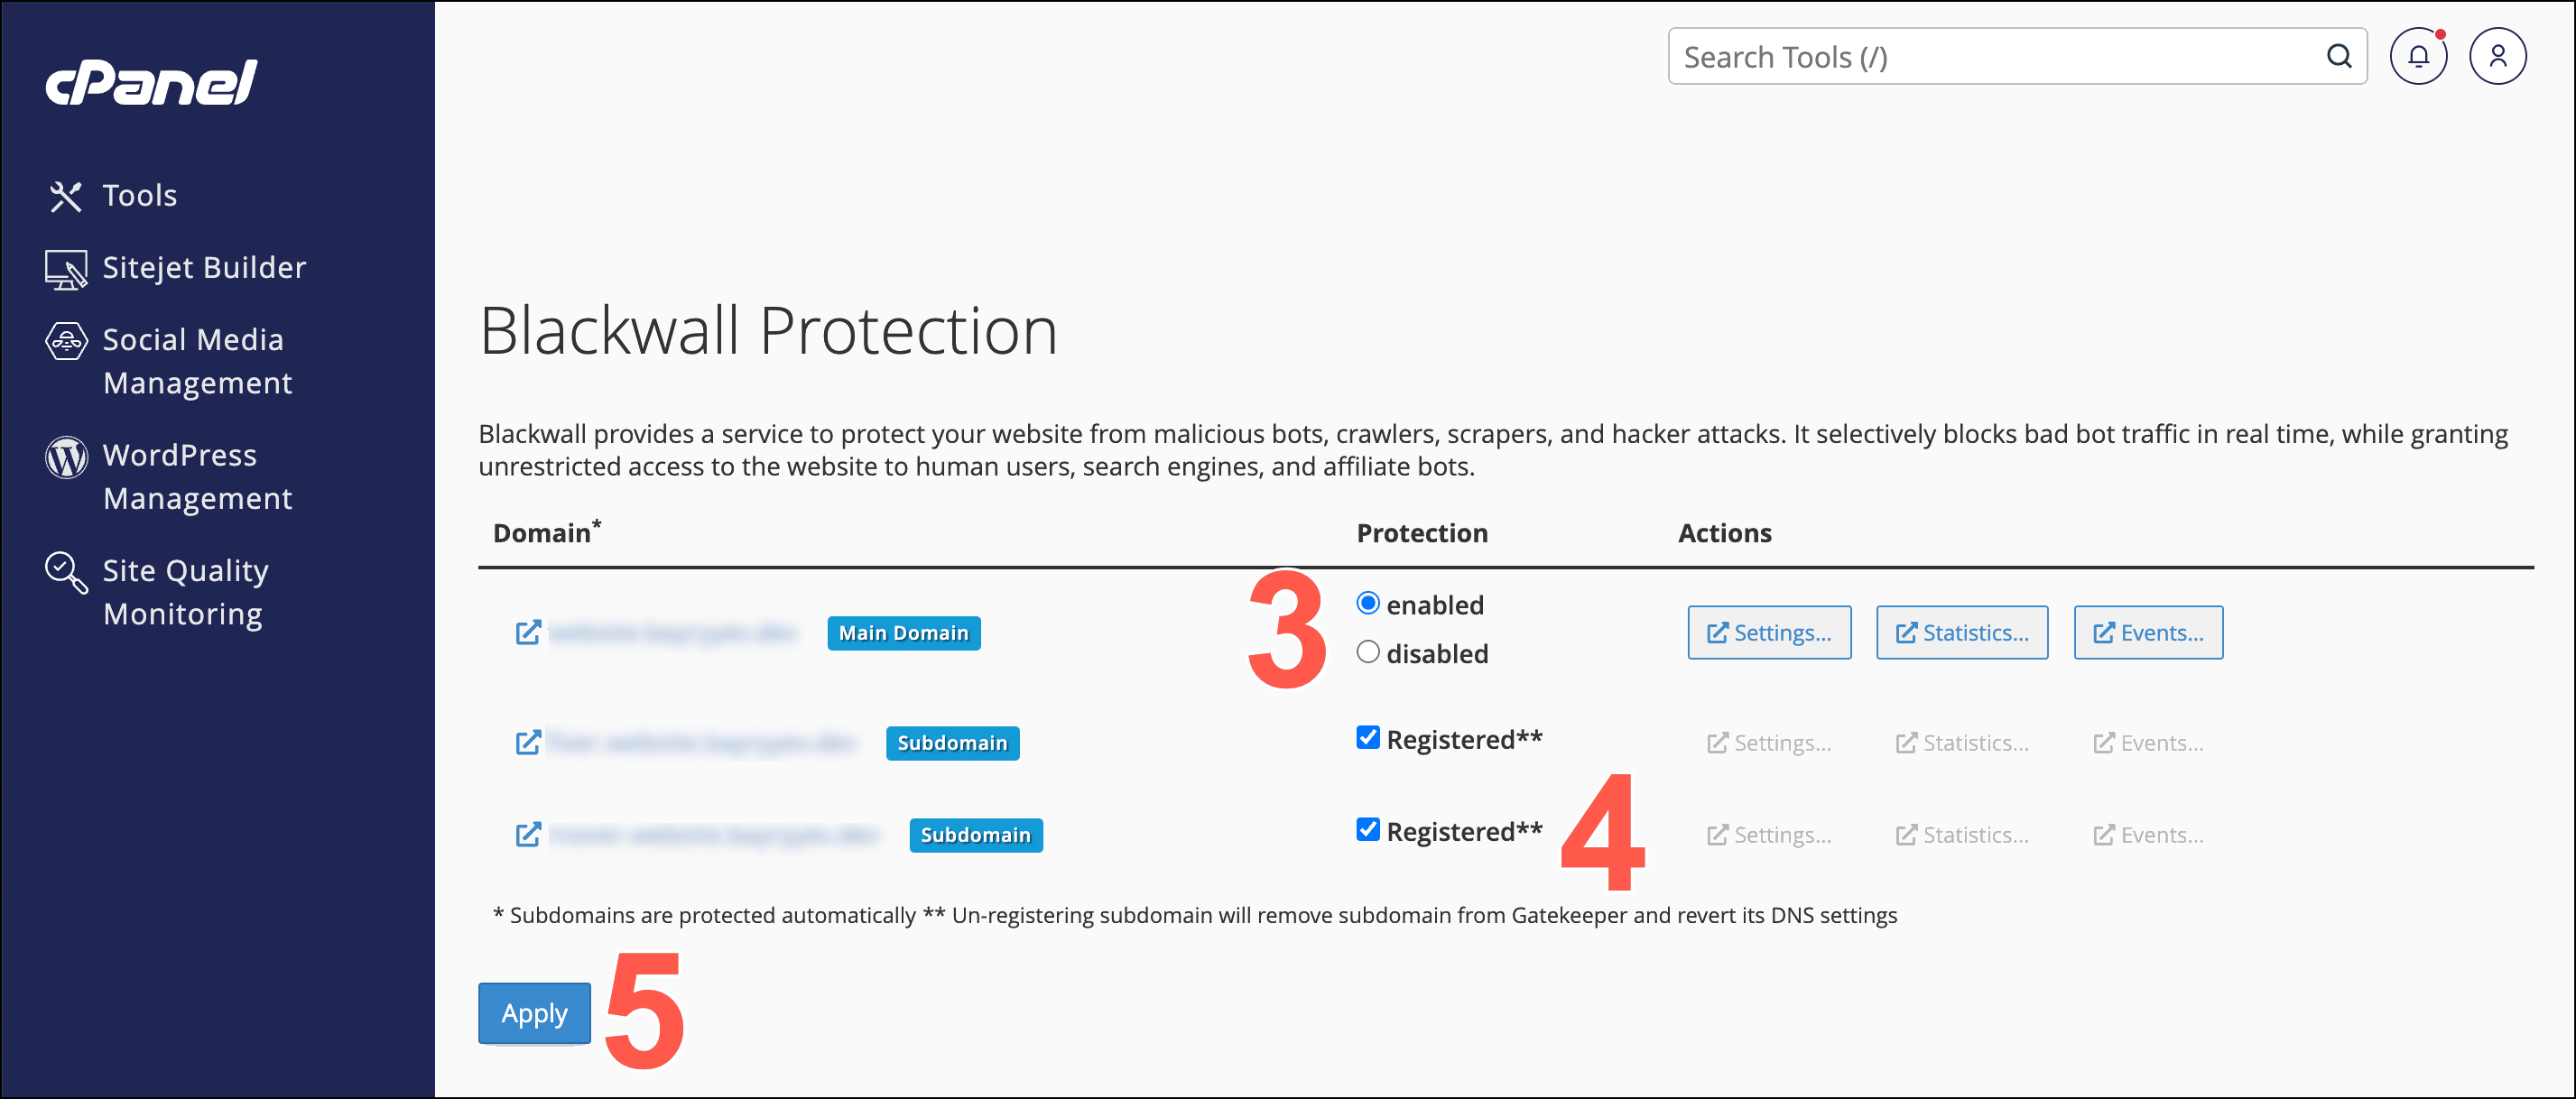
- To enable protection of listed subdomains, place a check/tick in the Registered checkbox beside each subdomain. To disable subdomain protection, remove this check/tick.
- Click Apply to execute any changes made.
- If enabling protection for the first time, ensure that you also configure your domain correctly by navigating to your domain's DNS settings. You can choose one of the following approaches:
- Automatic DNS configuration (recommended) — When DNS management of your domain is delegated to your cPanel, the Blackwall Protection module automatically manages and protects your DNS records for your website and its subdomains.
- Manual DNS configuration — Ensure sure that your domain has A/AAAA records pointing towards to your Gatekeeper IP addresses.
Monitoring & Analytics
In this section, you can learn how to view statistics and event logs relating to any domain protected by Blackwall.
View Statistics for a single domain
The Statistics page gives you a simple, comprehensive, and objective snapshot of your domain's security status and associated metrics. These aggregated results and statuses present in manageable chunks of visual information that enable you to see what's going well, what needs improvement, and if necessary, where you must take action.
Alternative: View global statistics for all domains in your account
Rather than viewing statistics for a single domain, alternatively, you can view global statistics for all domains associated with your CPanel account. To do this, follow these steps:
-
Log into your WHM interface:
-
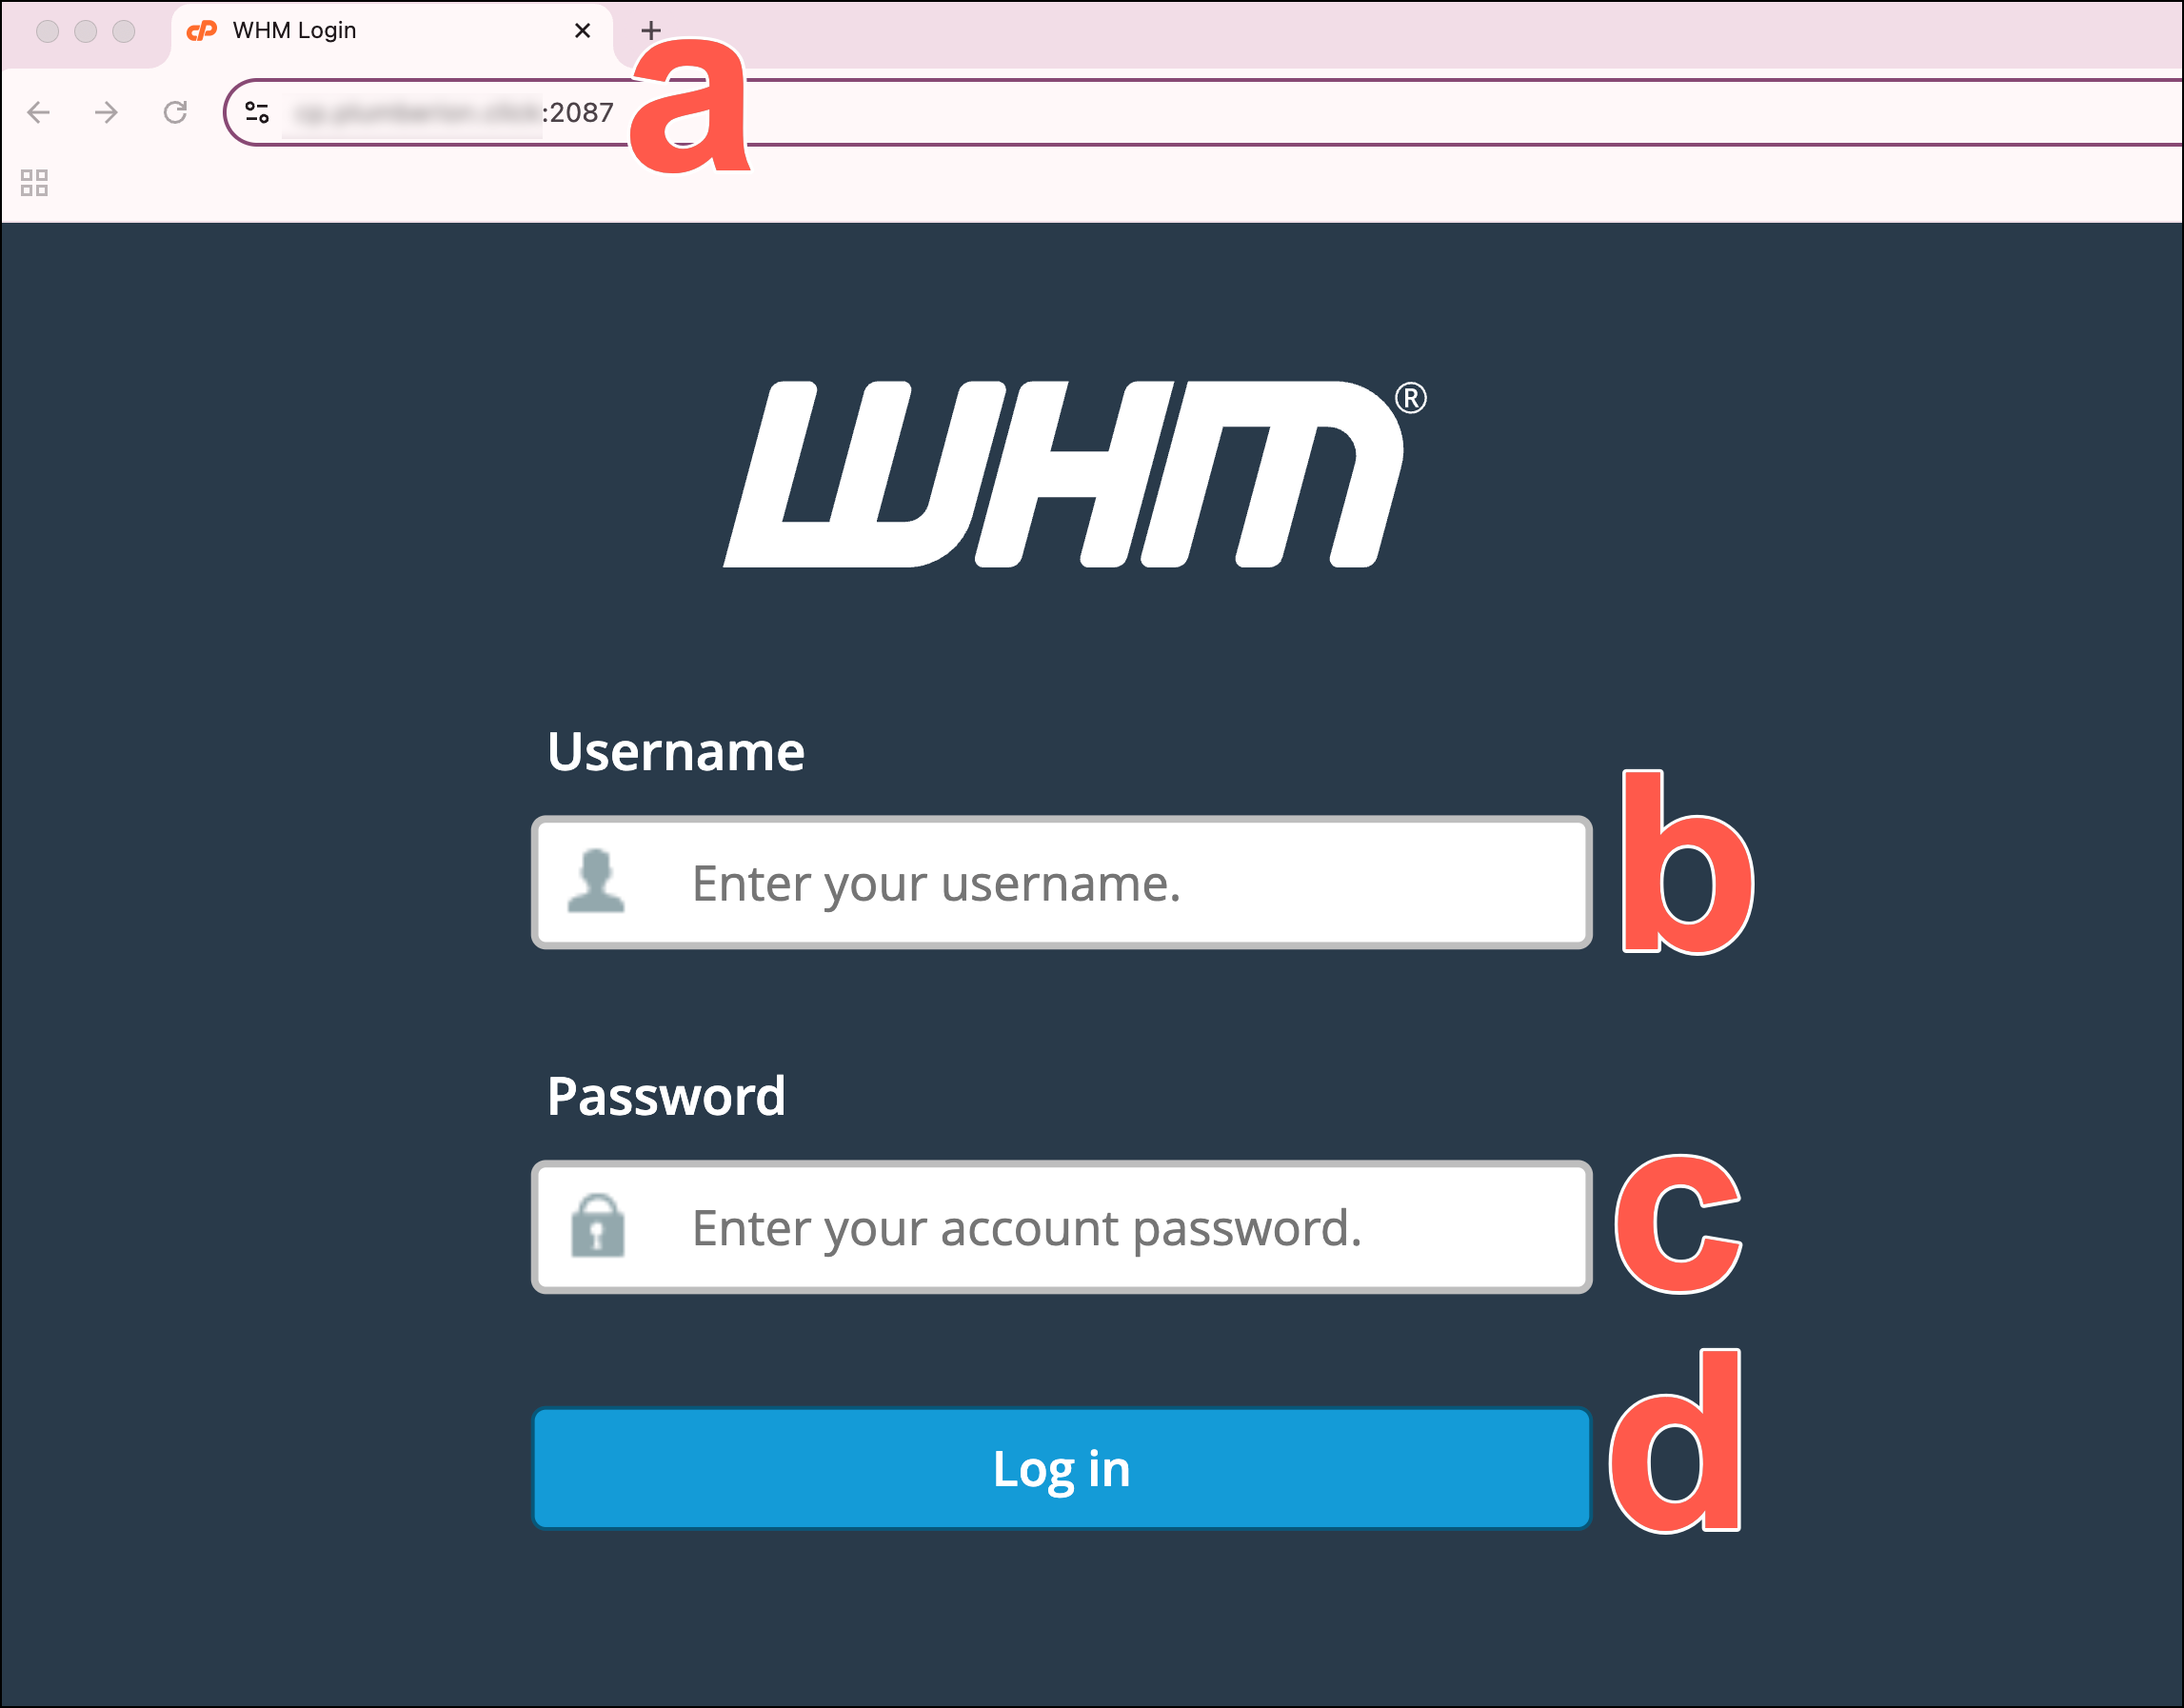
Using your preferred browser, enter the IP address or domain name followed by the 2087 service port in your preferred browser (for example, https://192.0.2.1:2087).
-
When the login screen displays, enter your WHM username in the Username field.
- Enter your password in the Password field.
- Click Log in.
-
-
In the left sidebar, scroll to the Plugins section and click Blackwall Protection. Alternatively, use the search bar at the the top of the sidebar to search for Blackwall Protection.
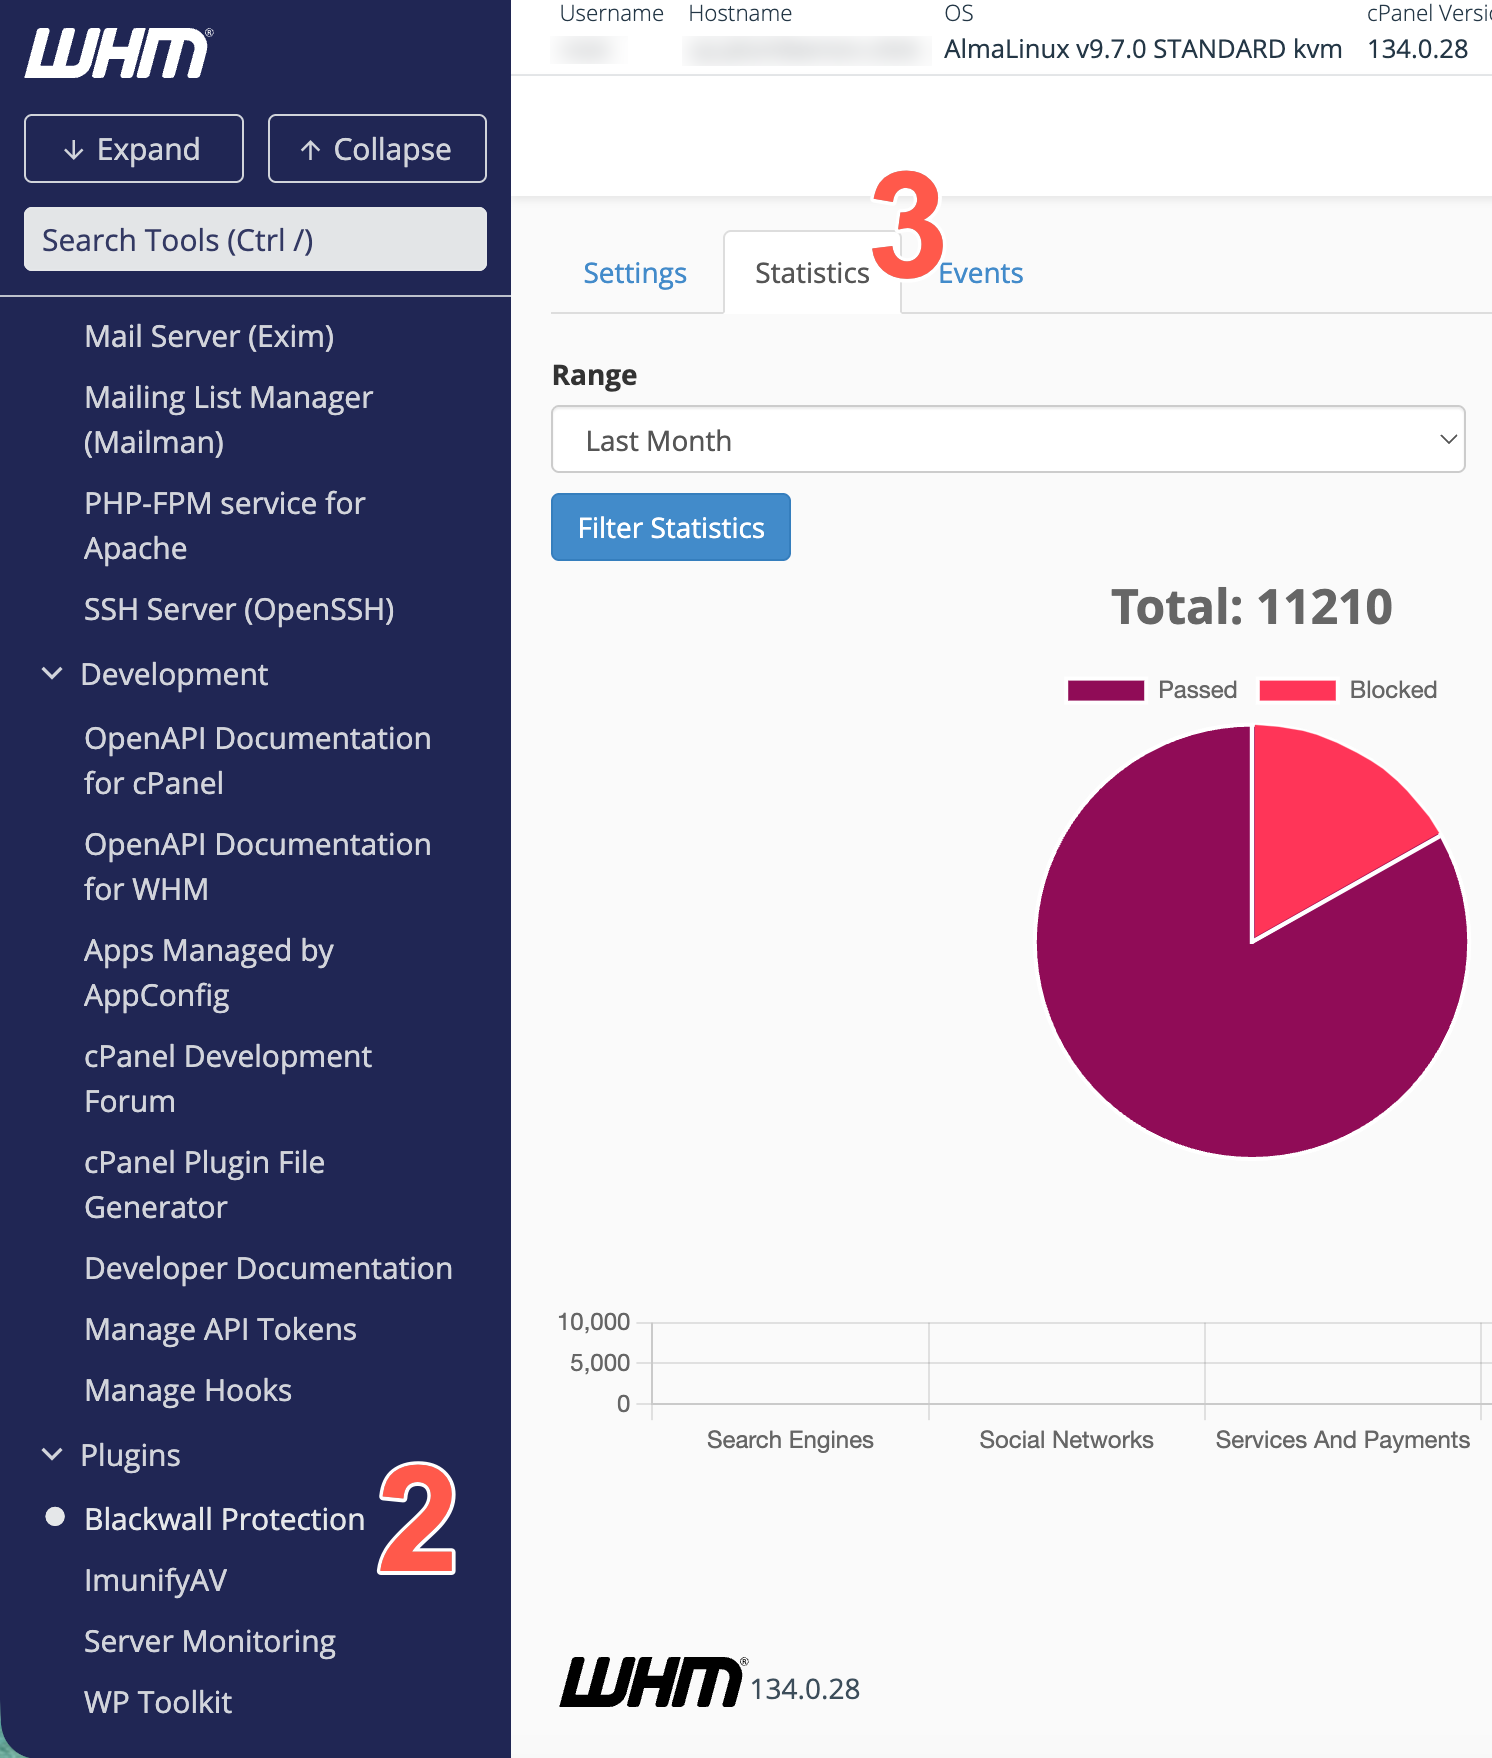
- From the tabs available, select Statistics.
- The layout and user guide is then the same as steps 4-7 below.
To access your Statistics from your cPanel plugin:
- Access the Blackwall Protection plugin by following the steps in Accessing the plugin.
- On the page displayed, locate your website domain, or an associated subdomain.
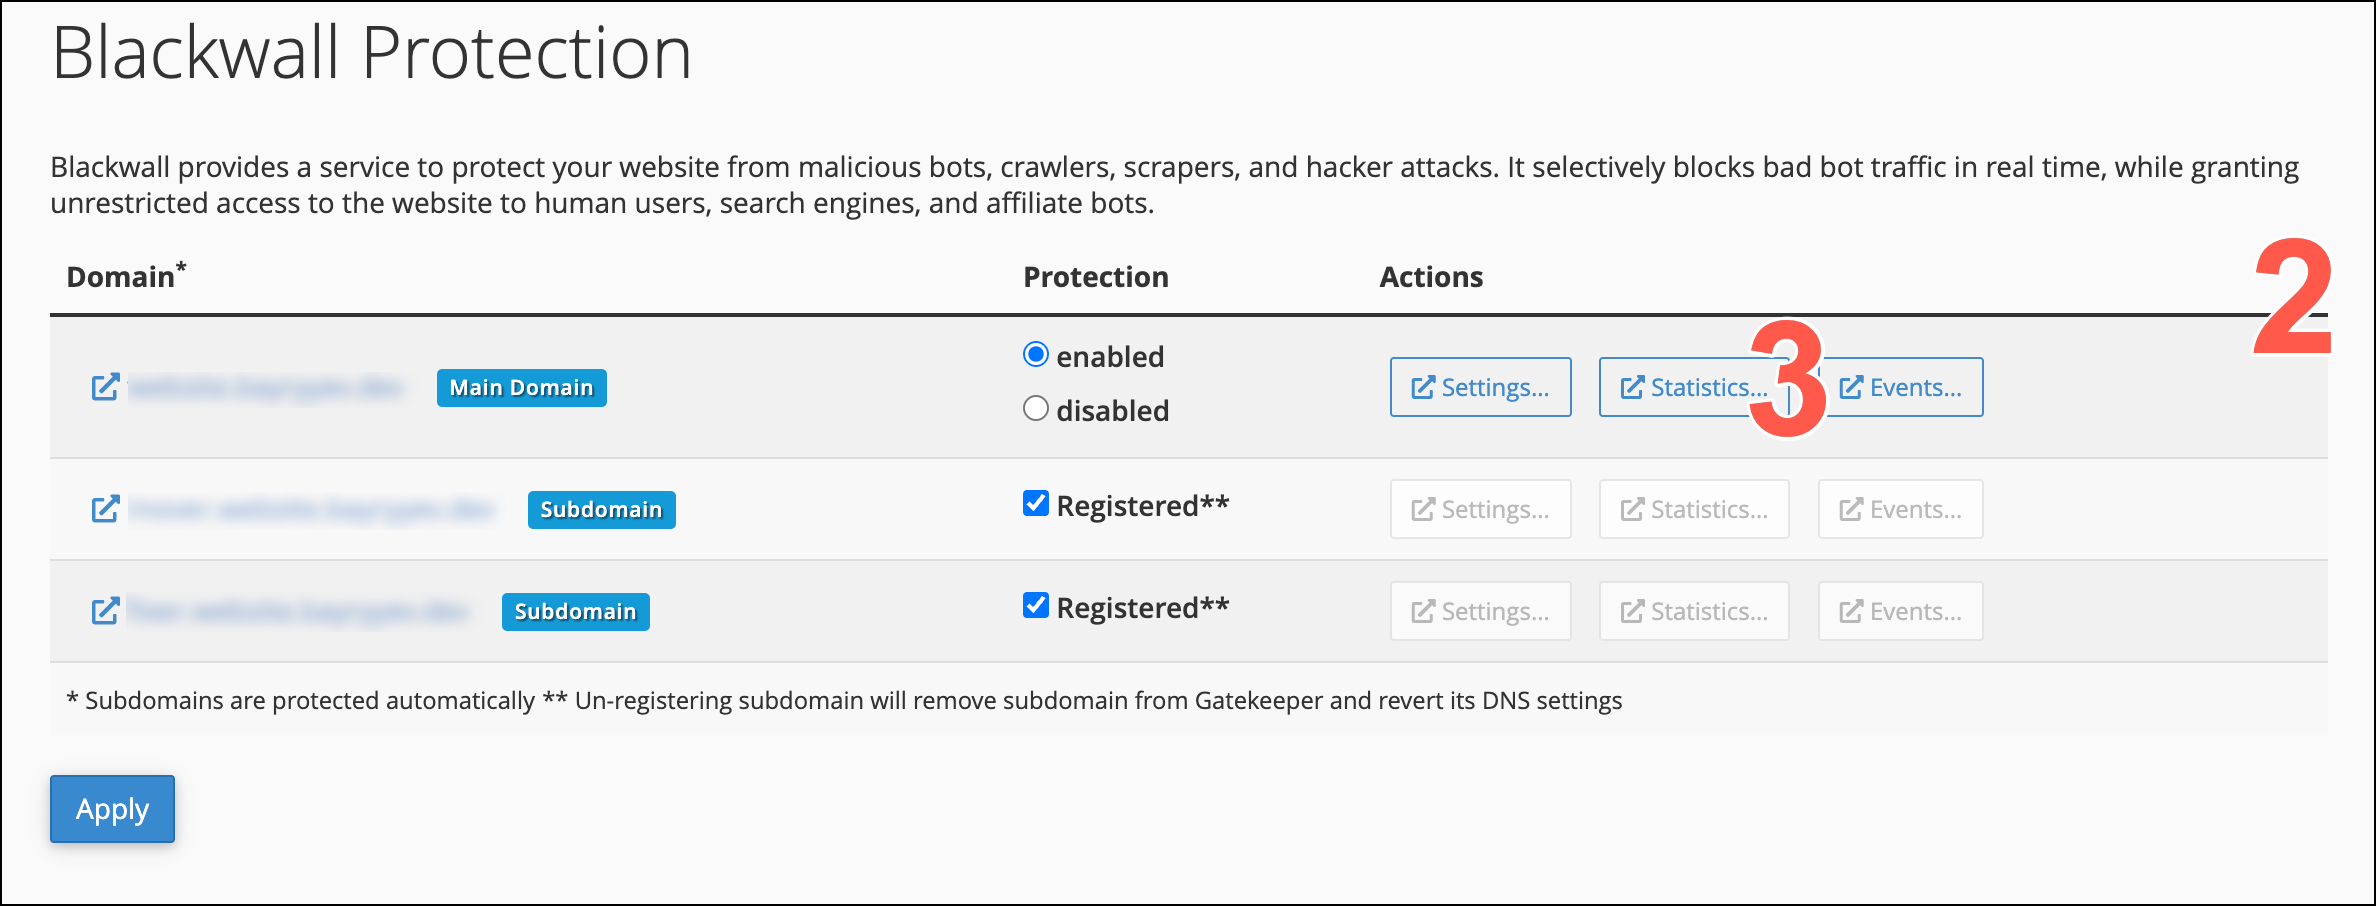
- From the actions available, click Statistics.
- The filters at the top of the page control what statistics display on the rest of the page. Last Hour is the default selection. To view statistics for a different time frame, click one of the other options: Last Day, Last Week, or Last Month.
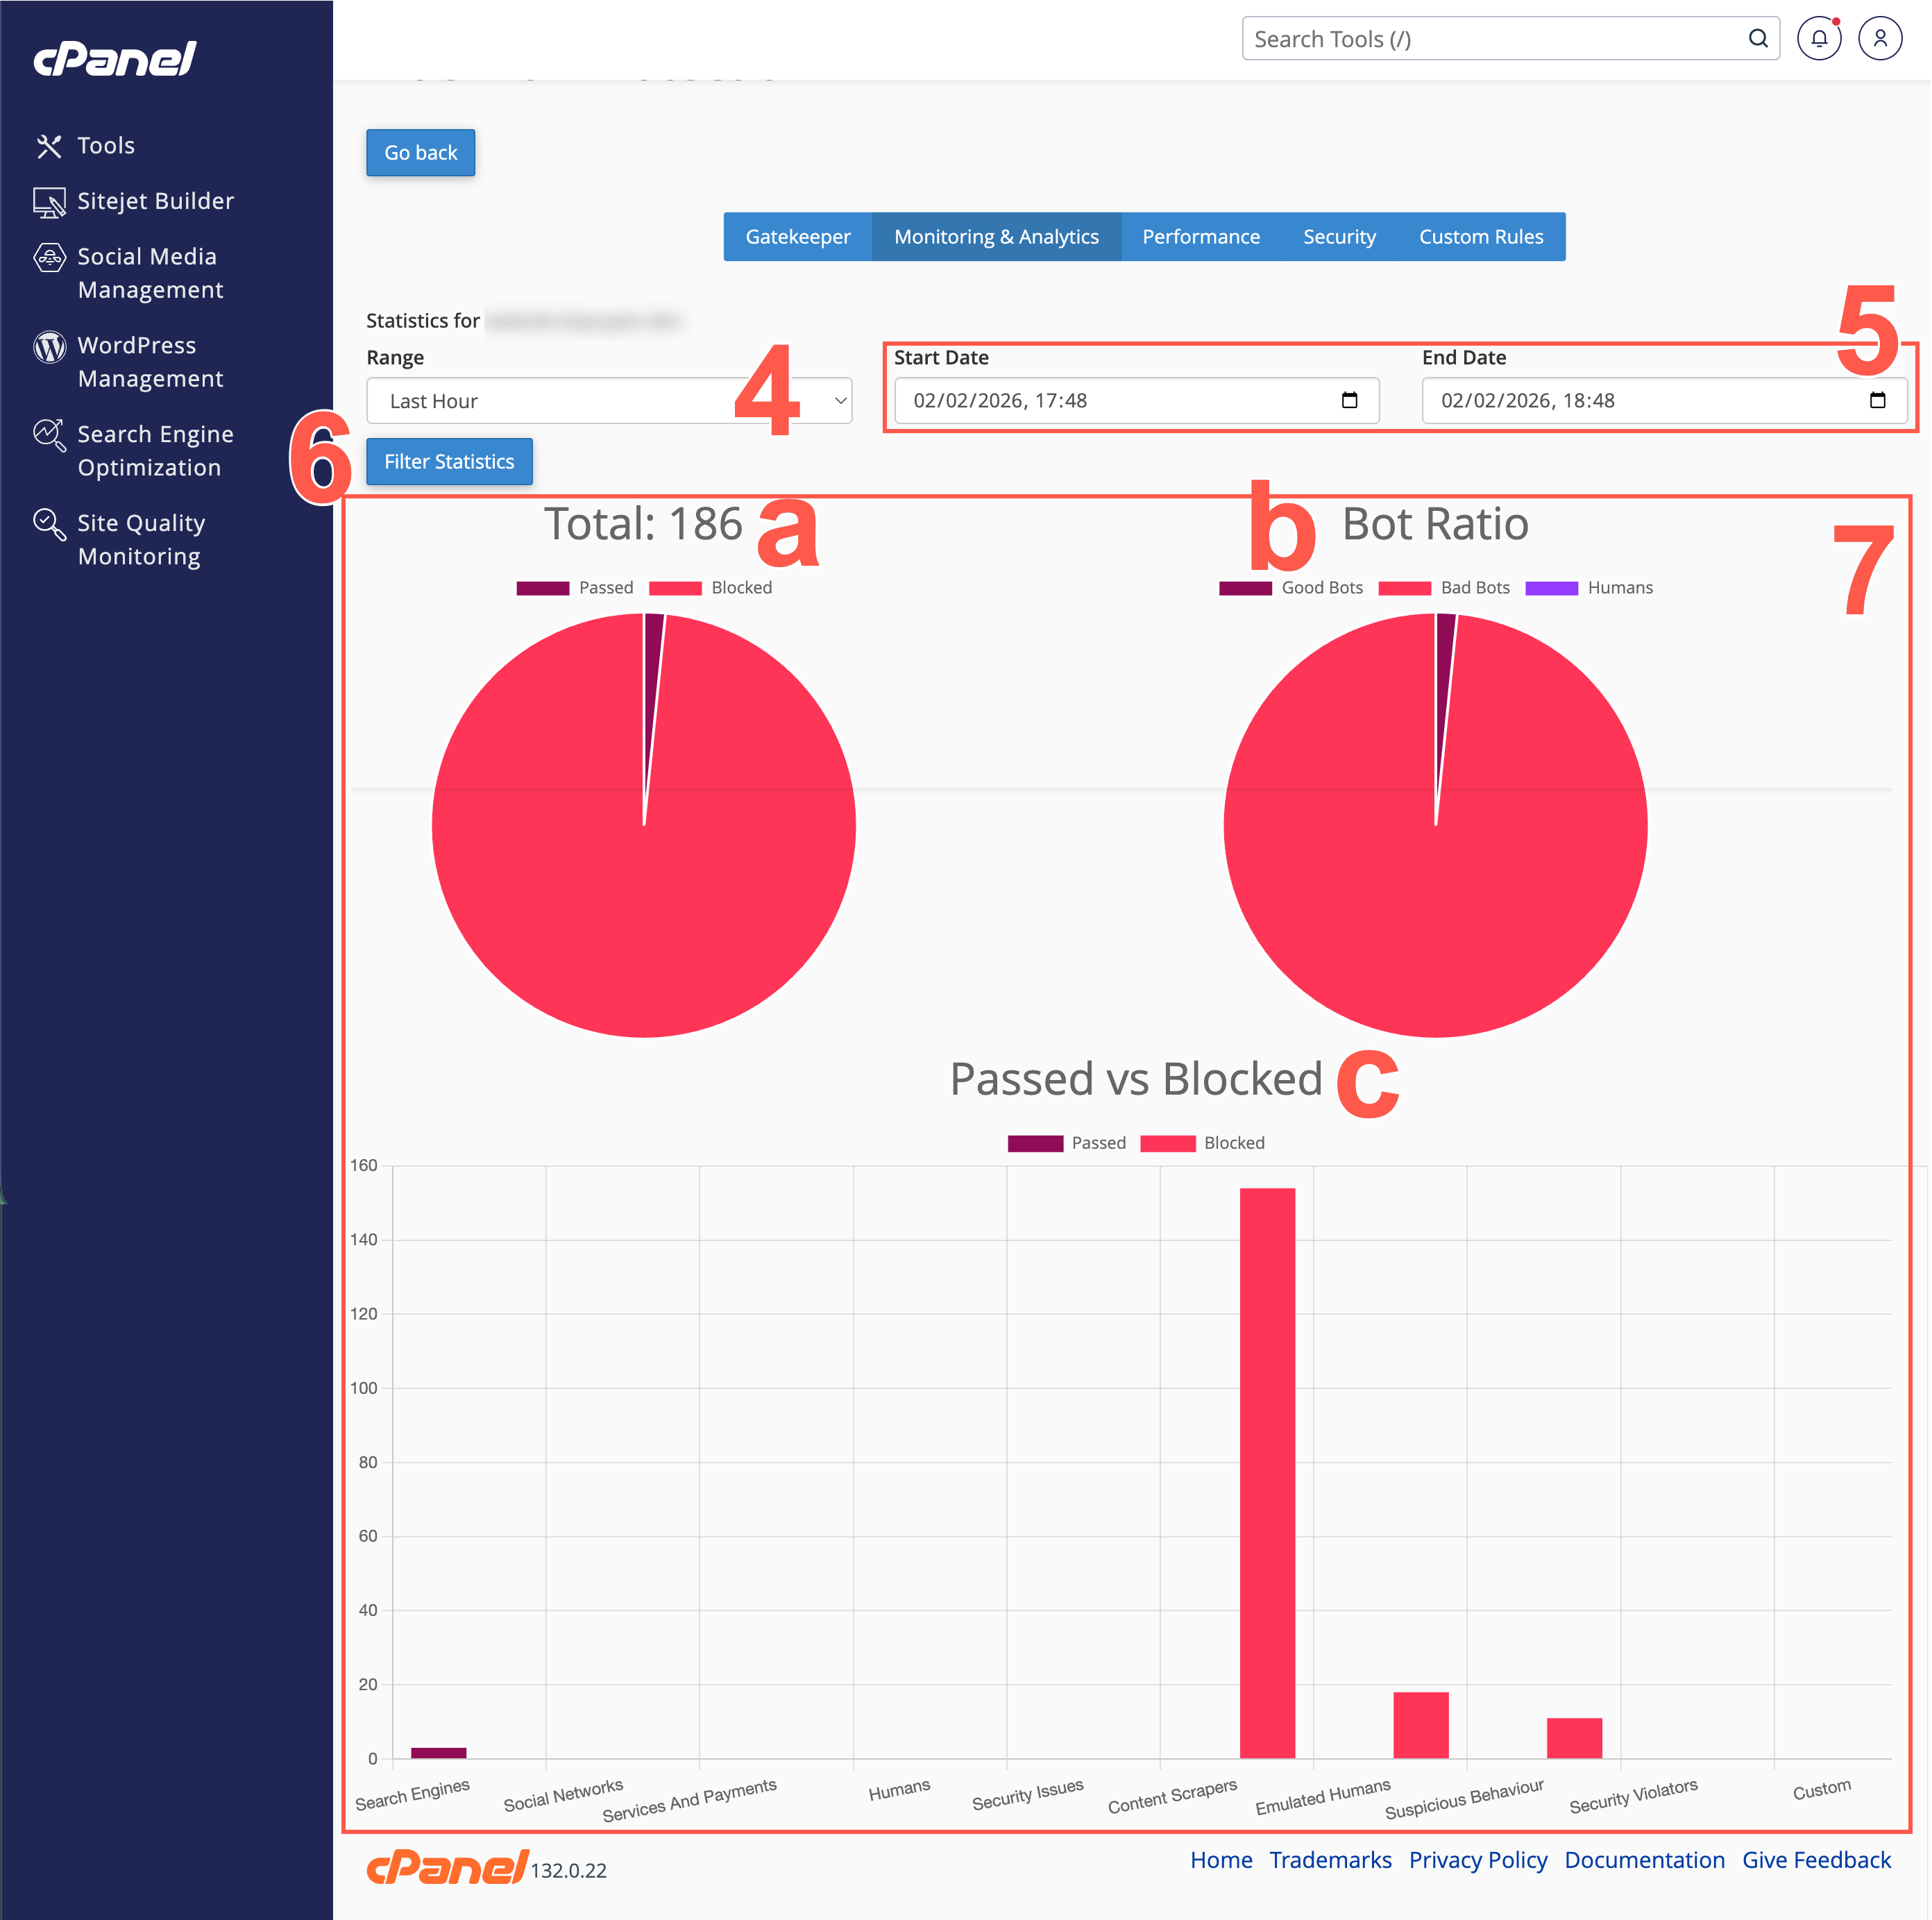
- Alternative to the previous step, use the two date selector fields to set a start and end date for your custom time period.
- Click Filter Statistics to filter using your selected filter values.
- On this page, use the widgets displayed to learn more about the types of threats that make up the metrics for your assets.
- The Total widget presents a graphical display of the total web traffic, and the breakdown of what web traffic passed and failed in GateKeeper.
- This Bot Ratio provides a graphical breakdown of Good Bot versus Bad Bot versus Humans interactions with your web assets.
- The Passed vs Blocked graph visually conveys the amount of web traffic in both the passed and failed status for each bot category.
View Events for a single domain
In the context of the Blackwall platform, Events are the actions, activities, or occurrences that the platform tracks and analyzes to determine whether traffic is generated by a human or a bot. Events are fundamental to Blackwall's detection capabilities, as they provide the raw data needed to make critical decisions about suspicious or malicious behavior.
Alternative: View global events for all domains in your account
Rather than viewing events for a single domain, alternatively, you can view global events for all domains associated with your CPanel account. To do this, follow these steps:
-
Log into your WHM interface:
-
Using your preferred browser, enter the IP address or domain name followed by the 2087 service port in your preferred browser (for example, https://192.0.2.1:2087).
-
When the login screen displays, enter your WHM username in the Username field.
- Enter your password in the Password field.
- Click Log in.
-
-
In the left sidebar, scroll to the Plugins section and click Blackwall Protection. Alternatively, use the search bar at the the top of the sidebar to search for Blackwall Protection.
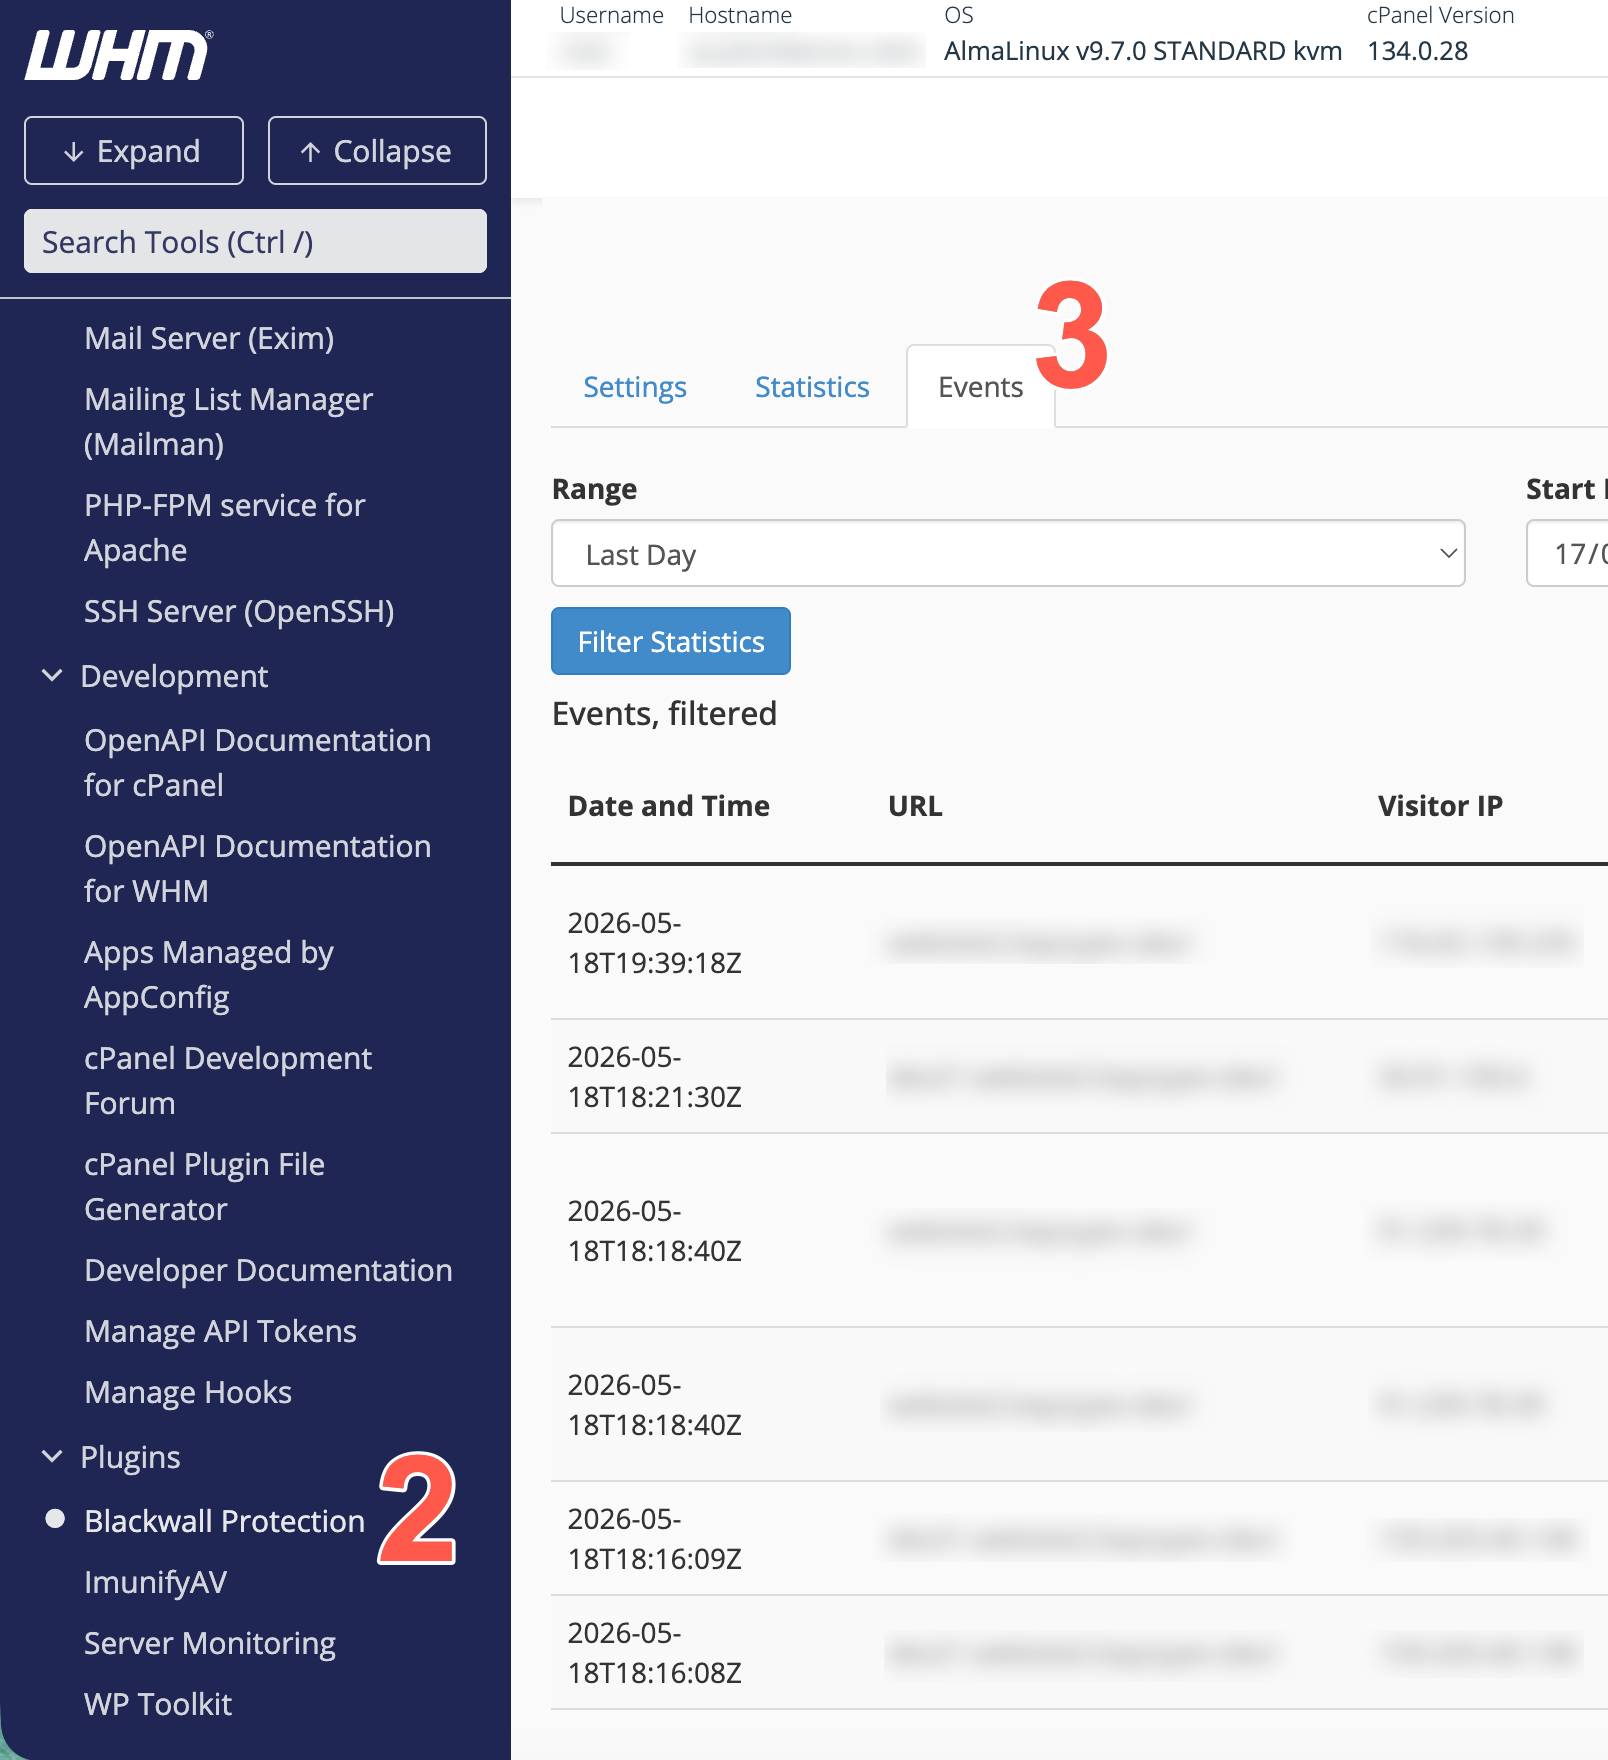
- From the tabs available, select Events.
- The layout and user guide is then the same as steps 4-7 below.
To access and view Events for your selected domain in cPanel, perform the following tasks:
- Access the Blackwall Protection plugin by following the steps in Accessing the plugin.
- On the page displayed, locate your website domain, or an associated subdomain.
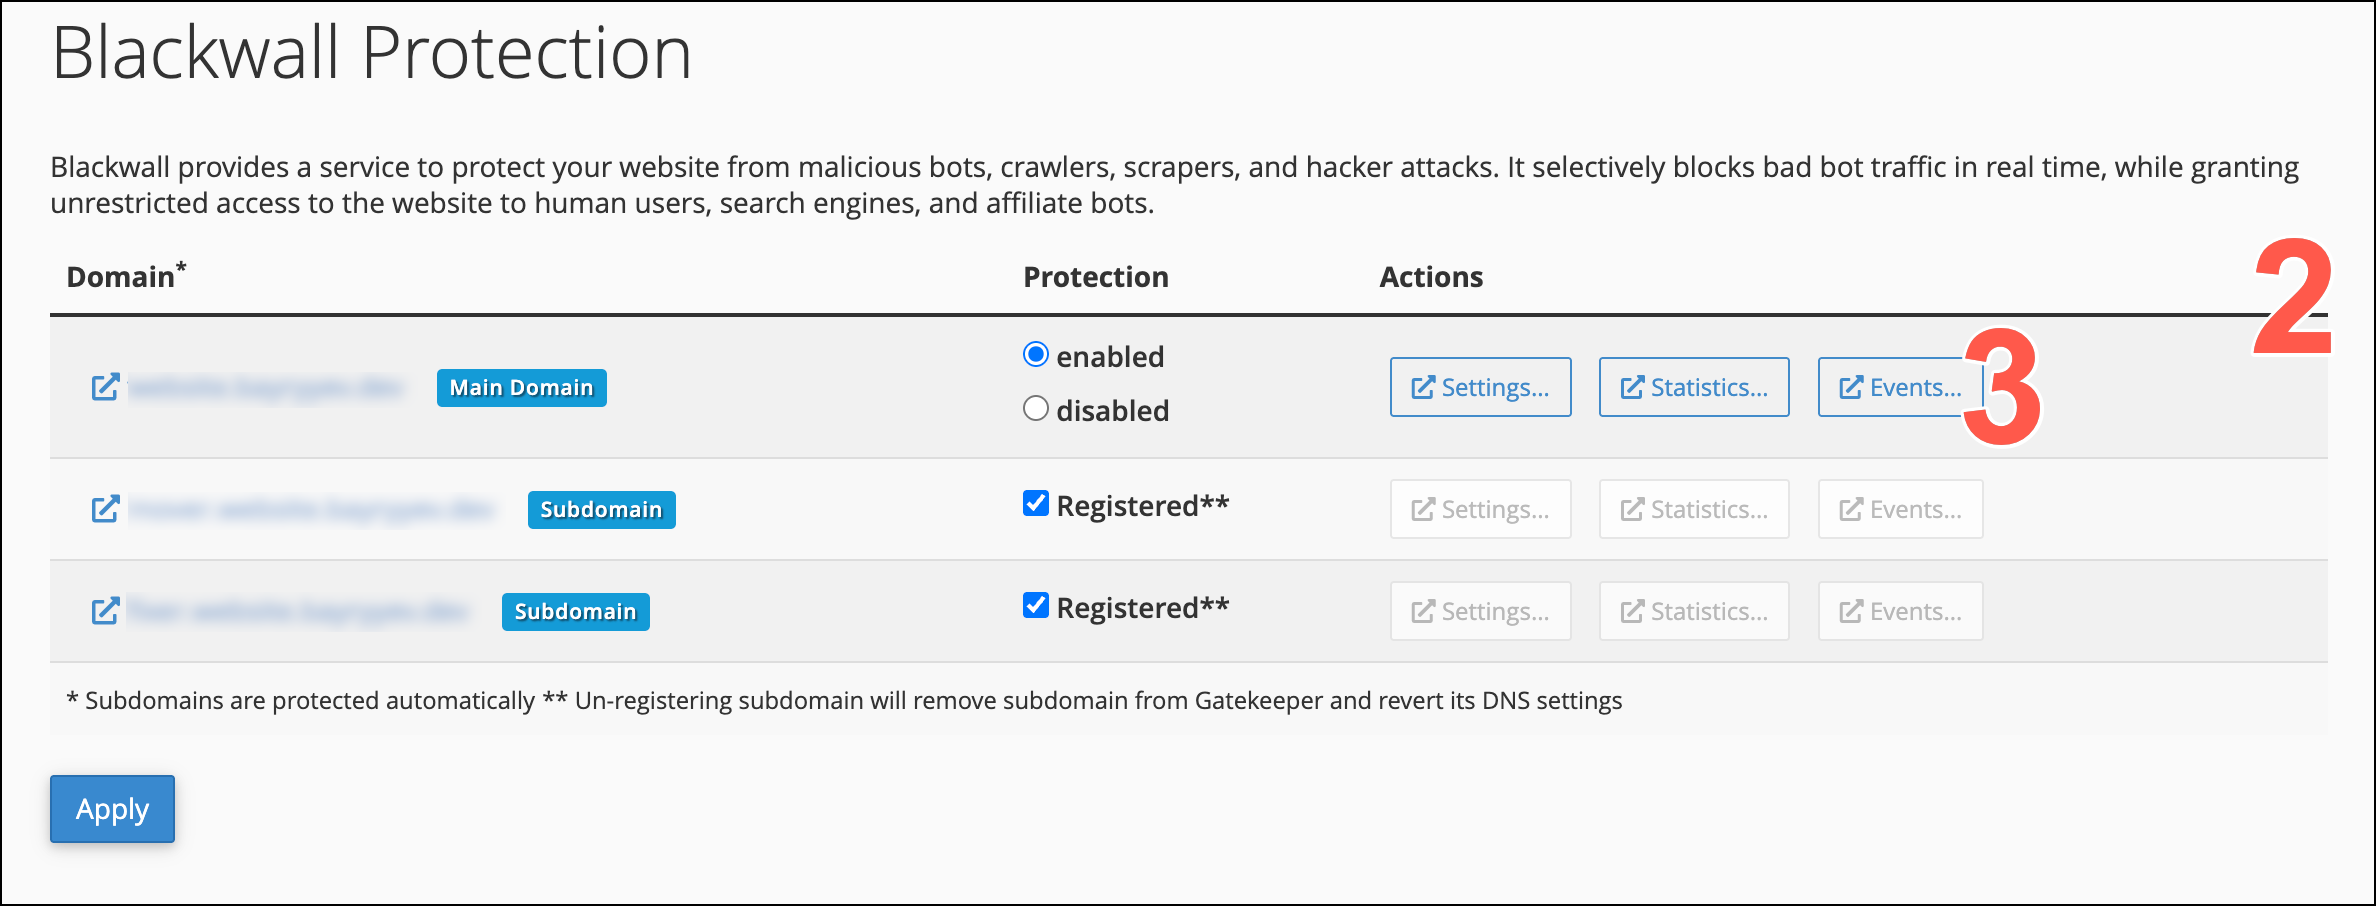
- From the actions available, click Events.
- The filters at the top of the page control what events display on this page. Last Hour is the default selection. To view events for a different time frame, click one of the other options: Last Day, Last Week, or Last Month.
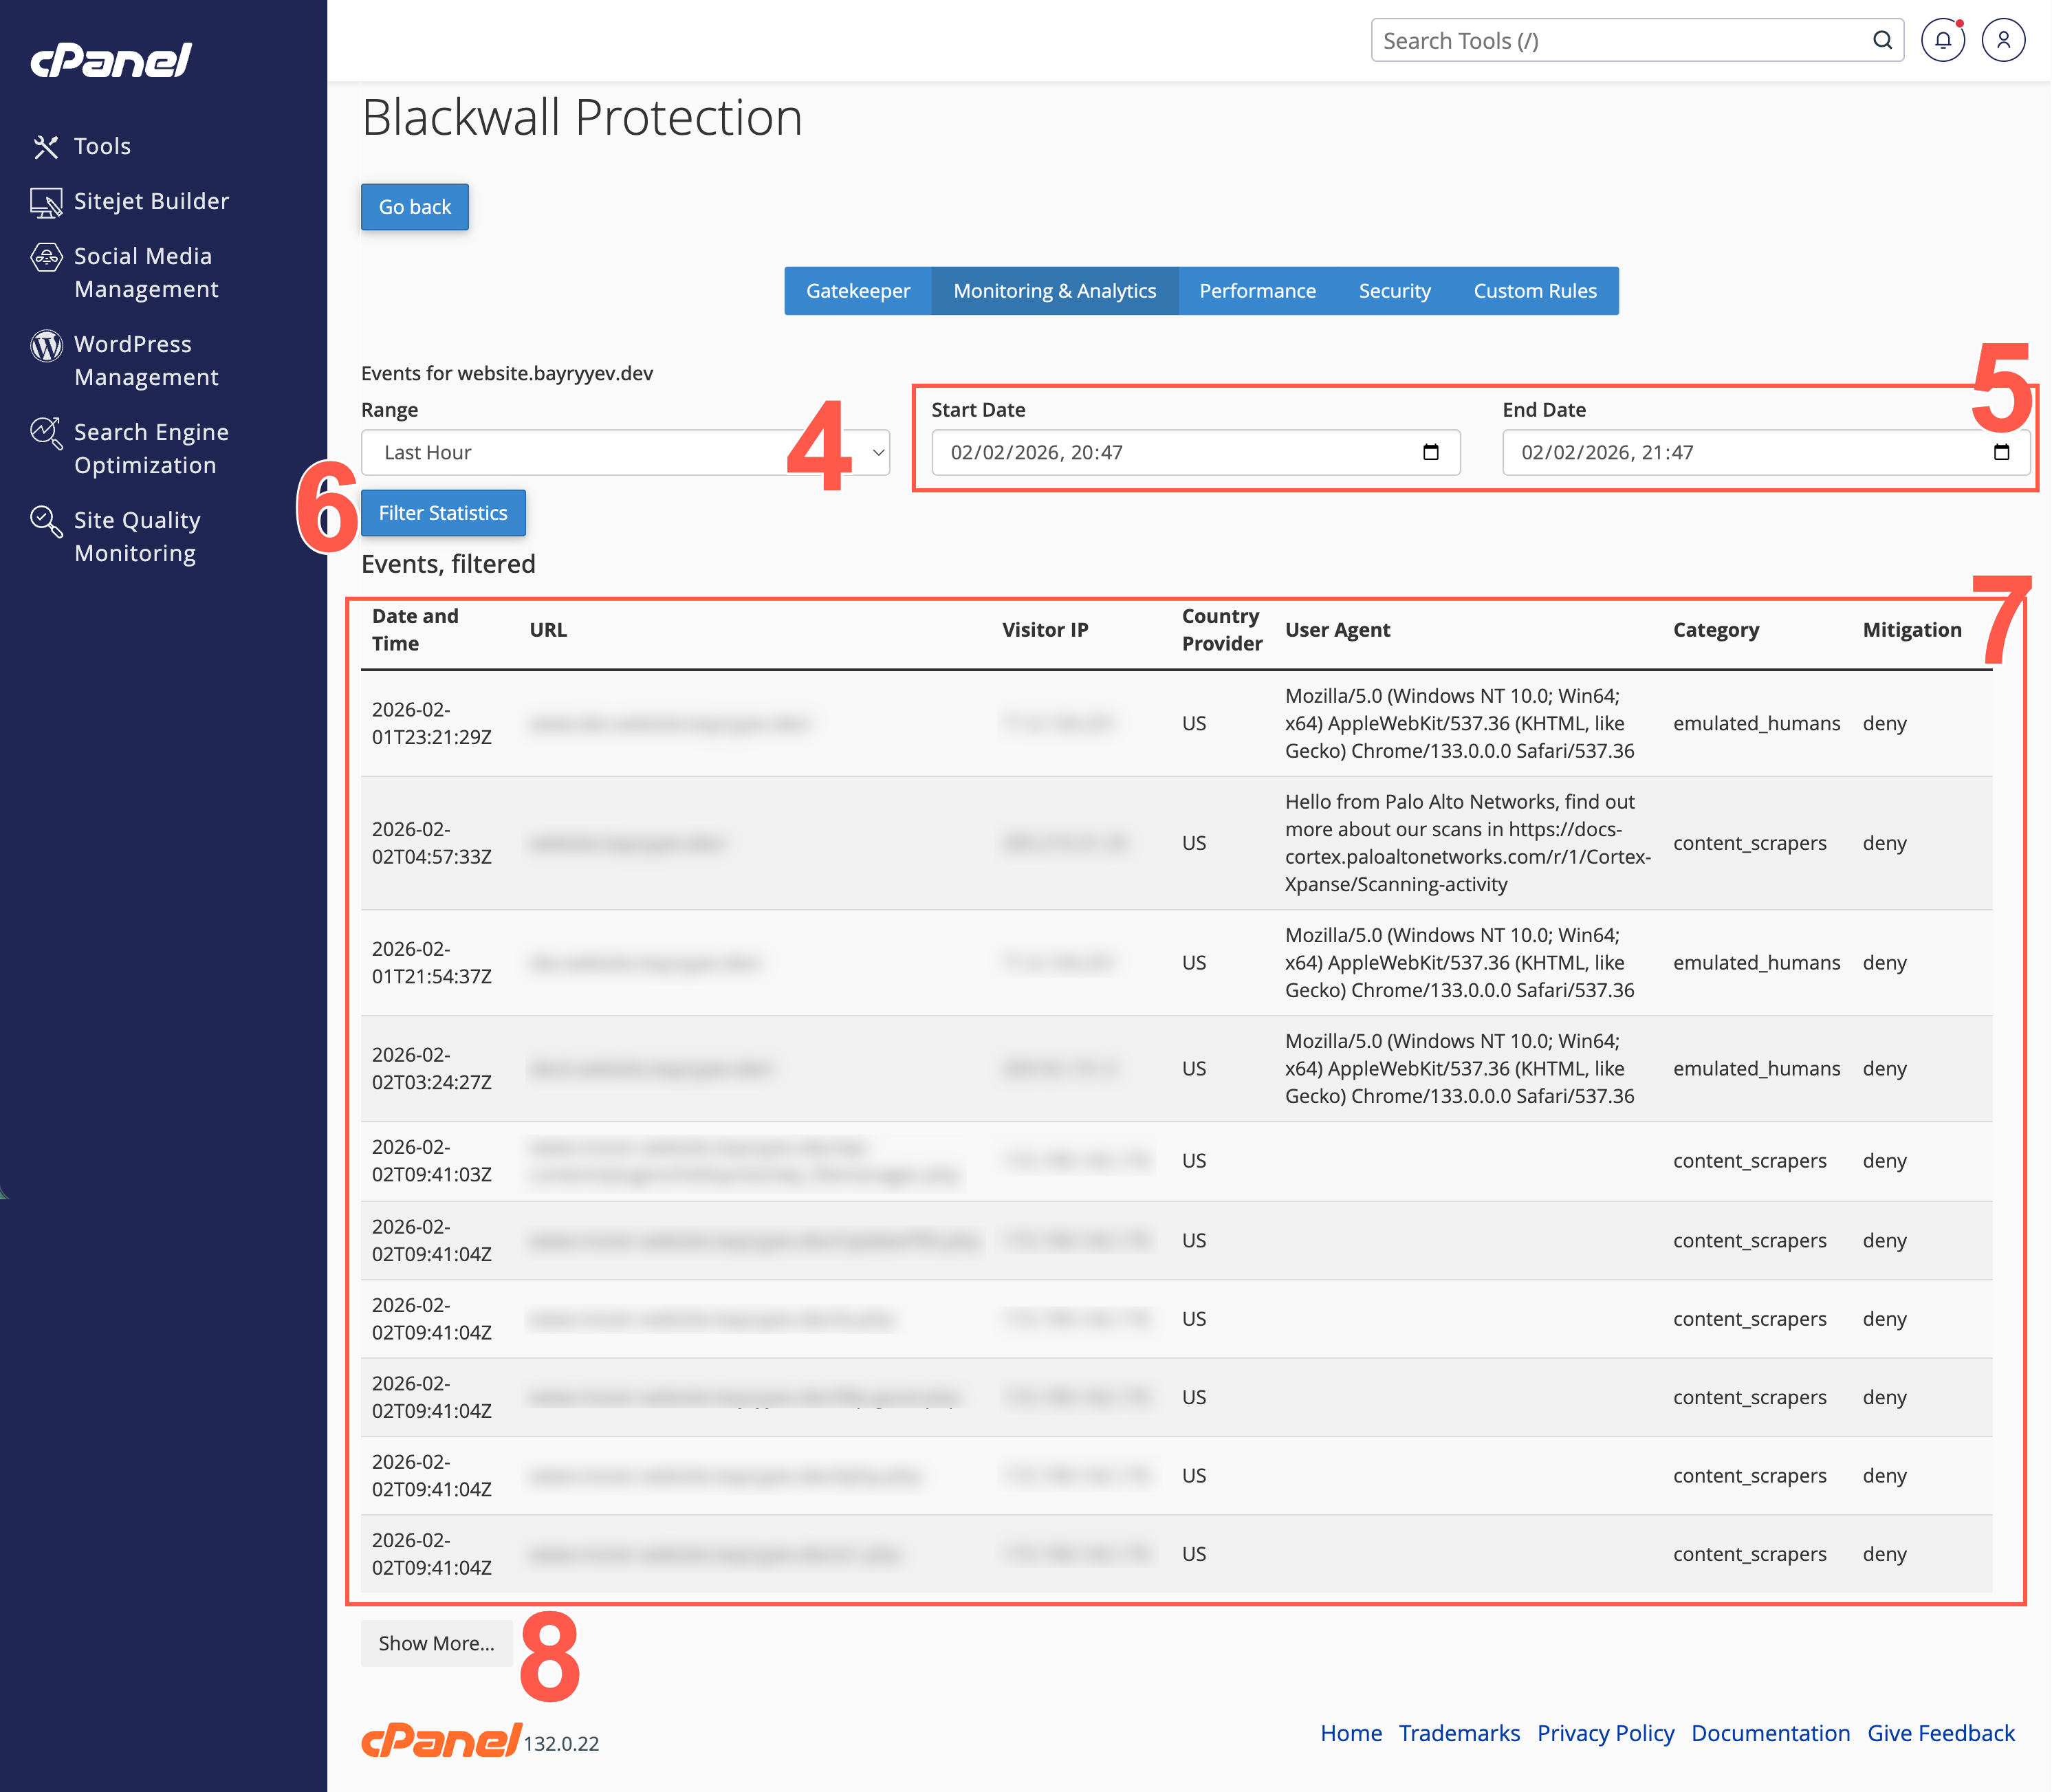
- Alternative to the previous step, use the two date selector fields to set a start and end date for your custom time period.
- Click Filter Statistics to filter using your selected filter values.
- View all traffic events in the filtered table that displays.
- Optionally, click Show More to expand the table to show more events.
Troubleshooting
If GateKeeper does not display the correct status, ensure that your domain’s DNS is updated correctly. The A (IPv4) and/or AAAA (IPv6) records must point to the public IP address of your Blackwall GateKeeper instance. Otherwise, you will receive an error similar to this: